The openaq package provides convenience functions to help plot data
extending the base::plot function.
To visualize locations on a map, call the plot function
after returning a data frame from the list_locations
function call. A basic basemap with national boundaries is included
based on the Natural Earth
dataset via the maps
package. If maps is not installed, only the data points
will be plotted. Install it with install.packages("maps")
to include the world boundary overlay.
locations <- list_locations(
  bbox = c(xmin = 6.291990, ymin = 32.823129, xmax = 37.932615, ymax = 45.181129),
  parameters_id = 2,
  limit = 1000
)
plot(locations)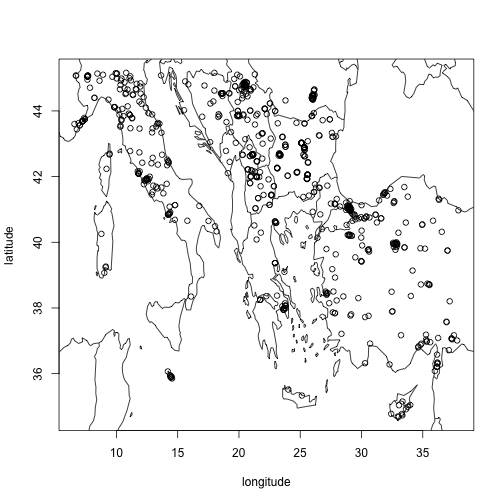
We can configure and customize the figure using standard
base::plot parameters in this example coloring the points
by provider and customizing the type of marker used.
plot(locations, col = locations$providers_id, pch = 20)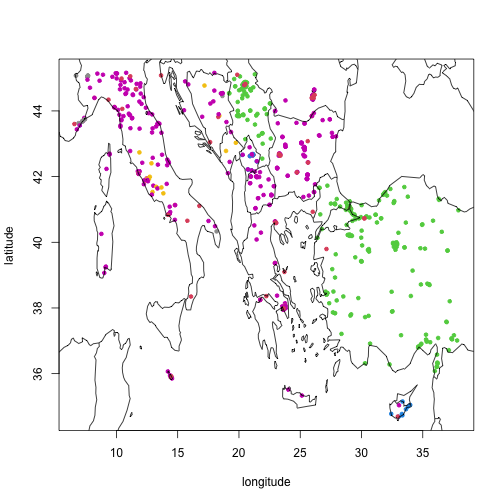
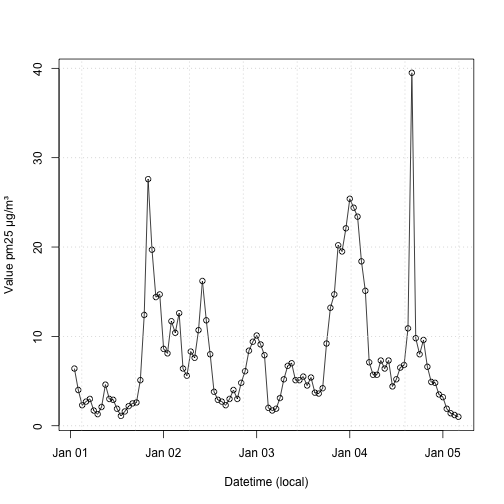
The list_sensor_measurements provides a
base::plot function to visualize the measurement values as
a time series line chart.
measurements <- list_sensor_measurements(
  3920,
  datetime_from = as.POSIXct("2025-01-01 00:00", tz = "America/Denver"),
  datetime_to = as.POSIXct("2025-01-15 23:00", tz = "America/Denver"),
)
plot(measurements)